Data Art in R: A case study using a bunch of pi digits
Happy Pi Day everyone!
Many people have done data art with pi digits (see this awesome collection of data art in R)–but I wanted to see if I could reproduce it myself by hacking some code together and am fairly pleased with the results. I think a couple of these images might become my new desktop wallpaper :)
Concept: Plot a “random walk” of sorts where the angle (amount of rotation) of the step which the random walker takes depends on the digit in the sequence.
|1| Download a million digits of pi from this website. Get it into a dataframe with one digit in each row.
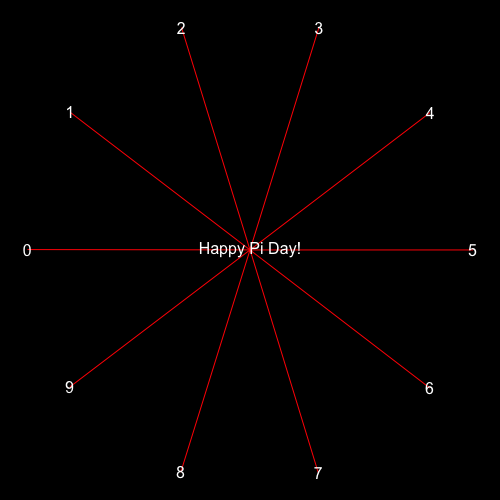
|2| Create a dataframe that indicates the x- and y-locations for each digit. This step is a bit tricky… Basically draw a circle and split it up into equal parts and figure out the x- and y-distances for the center point of the circle to get there… The legend below should help.
|3| Merge the dataframes from steps 1 and 2.
|4| Plot the individual line segments via a for loop. Voilà!
First 11 digits of pi

First 101 digits of pi

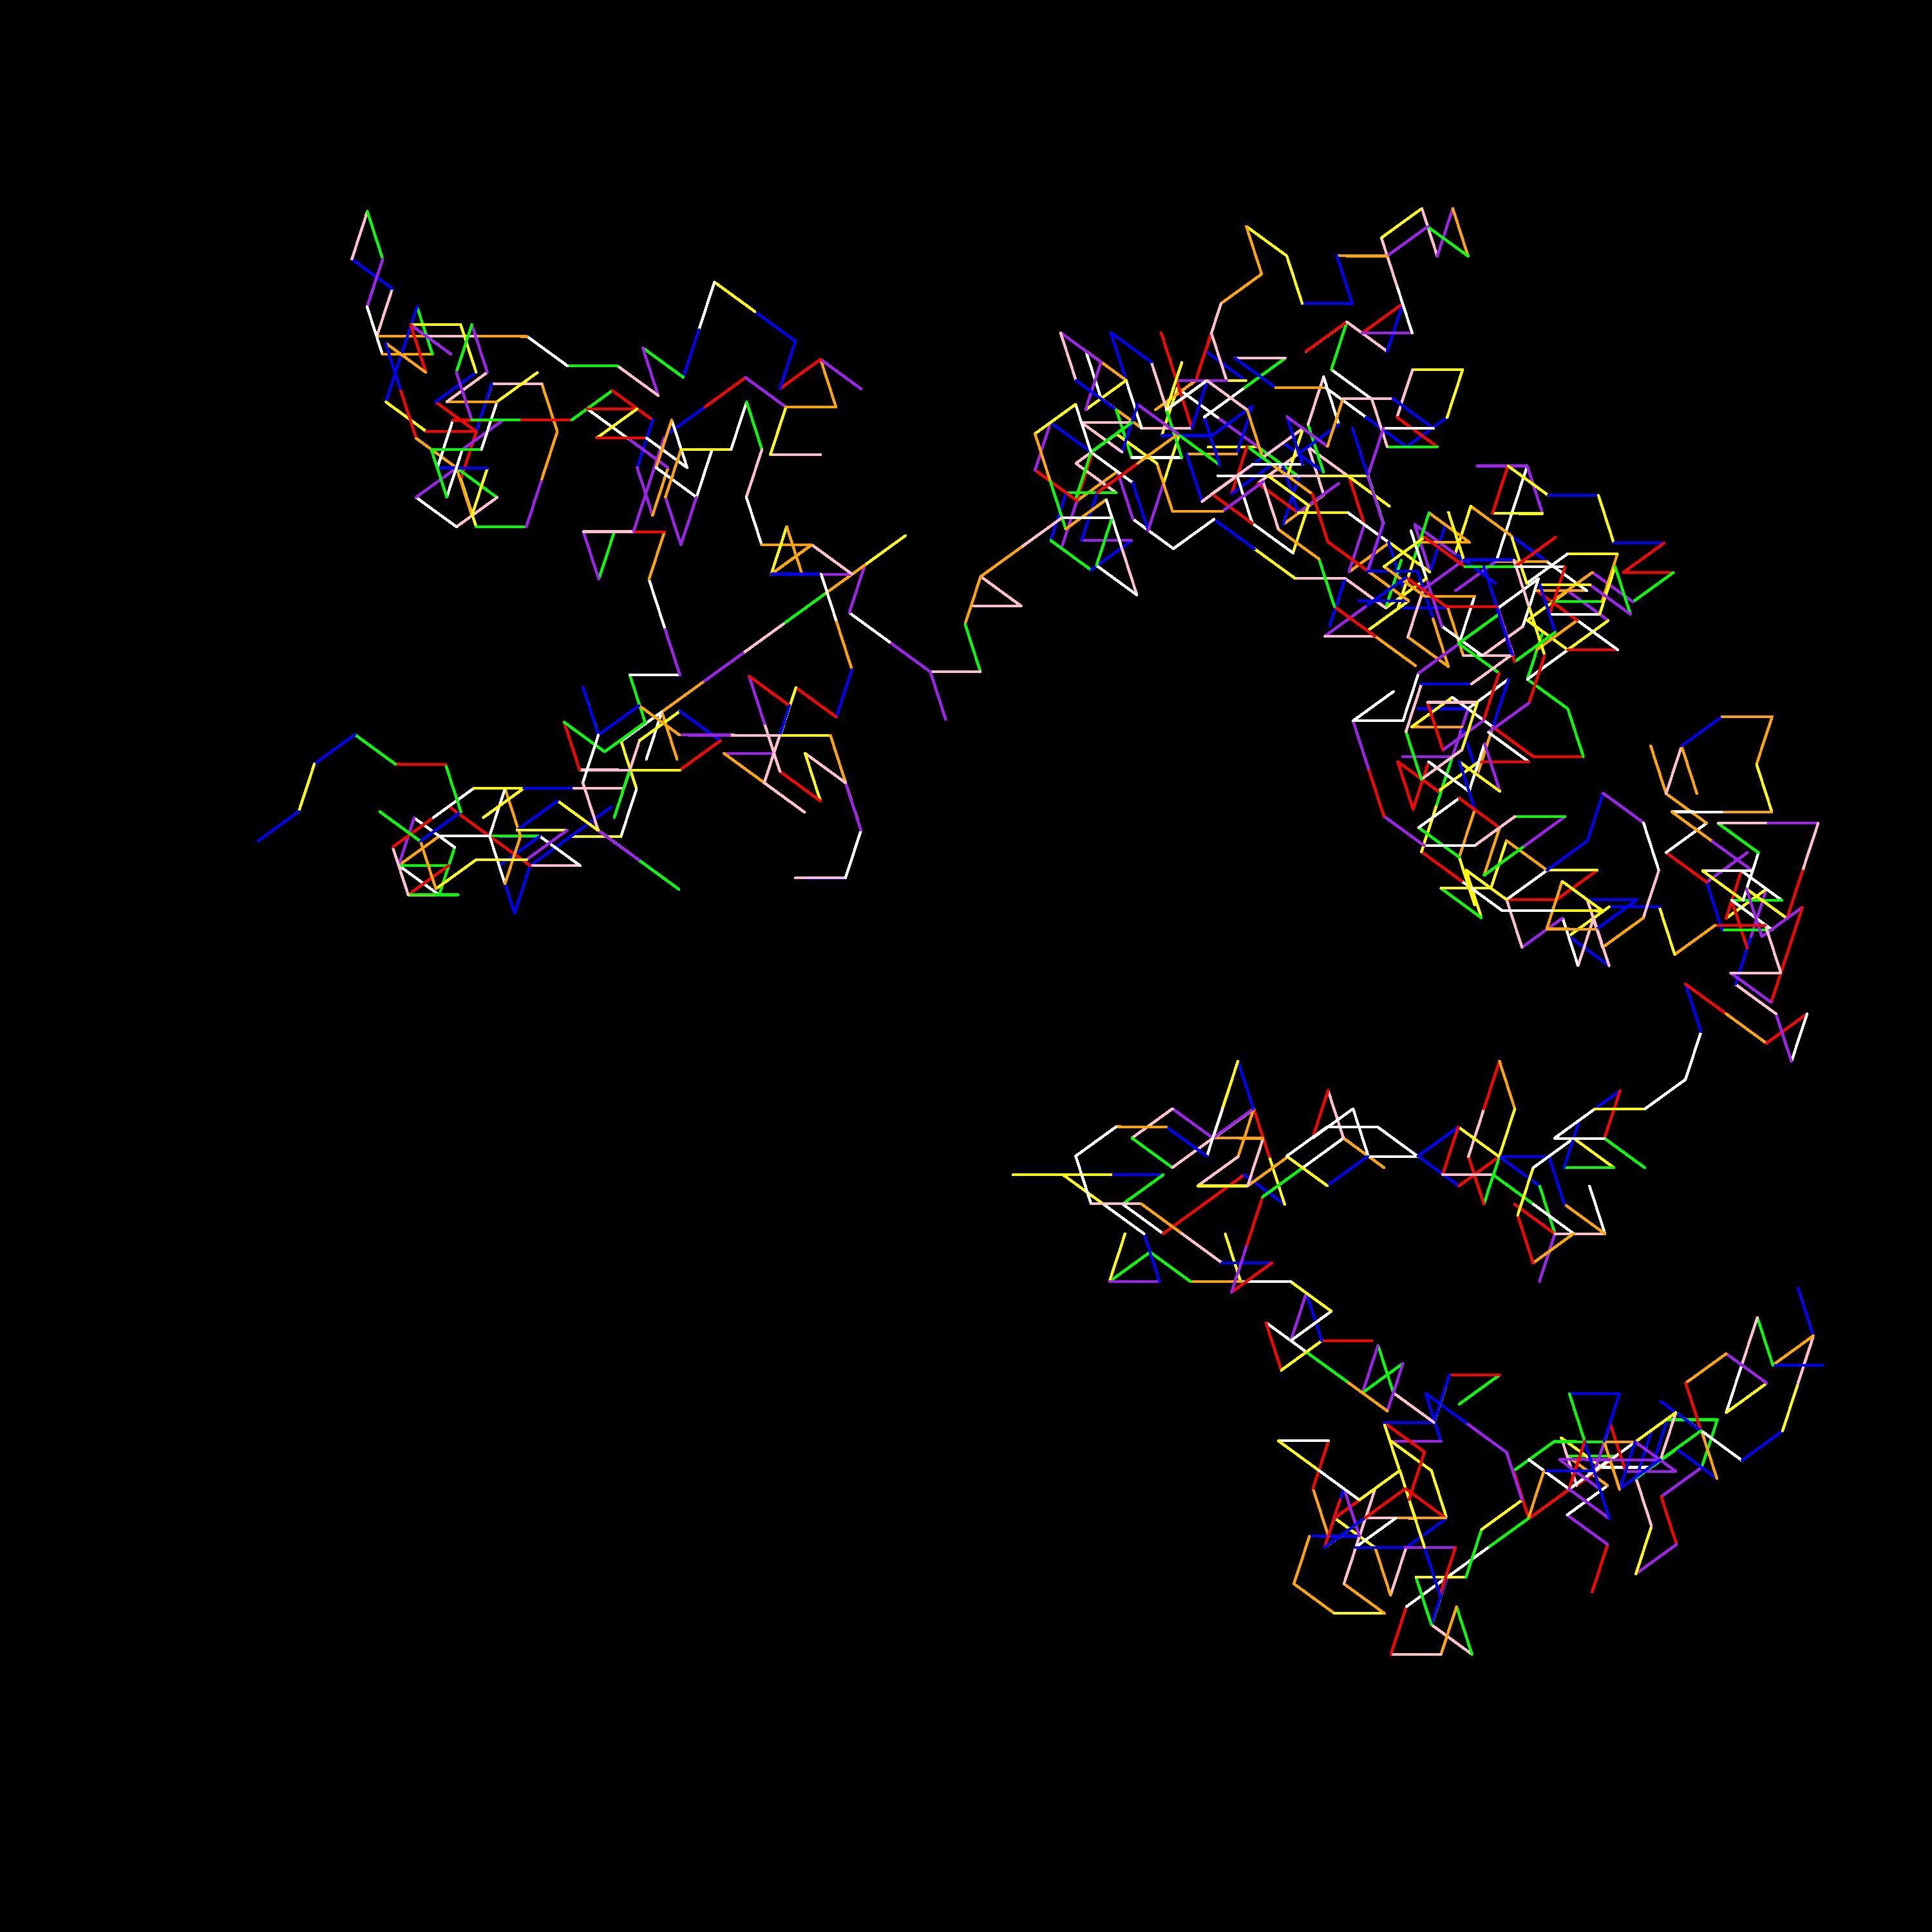
First 1001 digits of pi
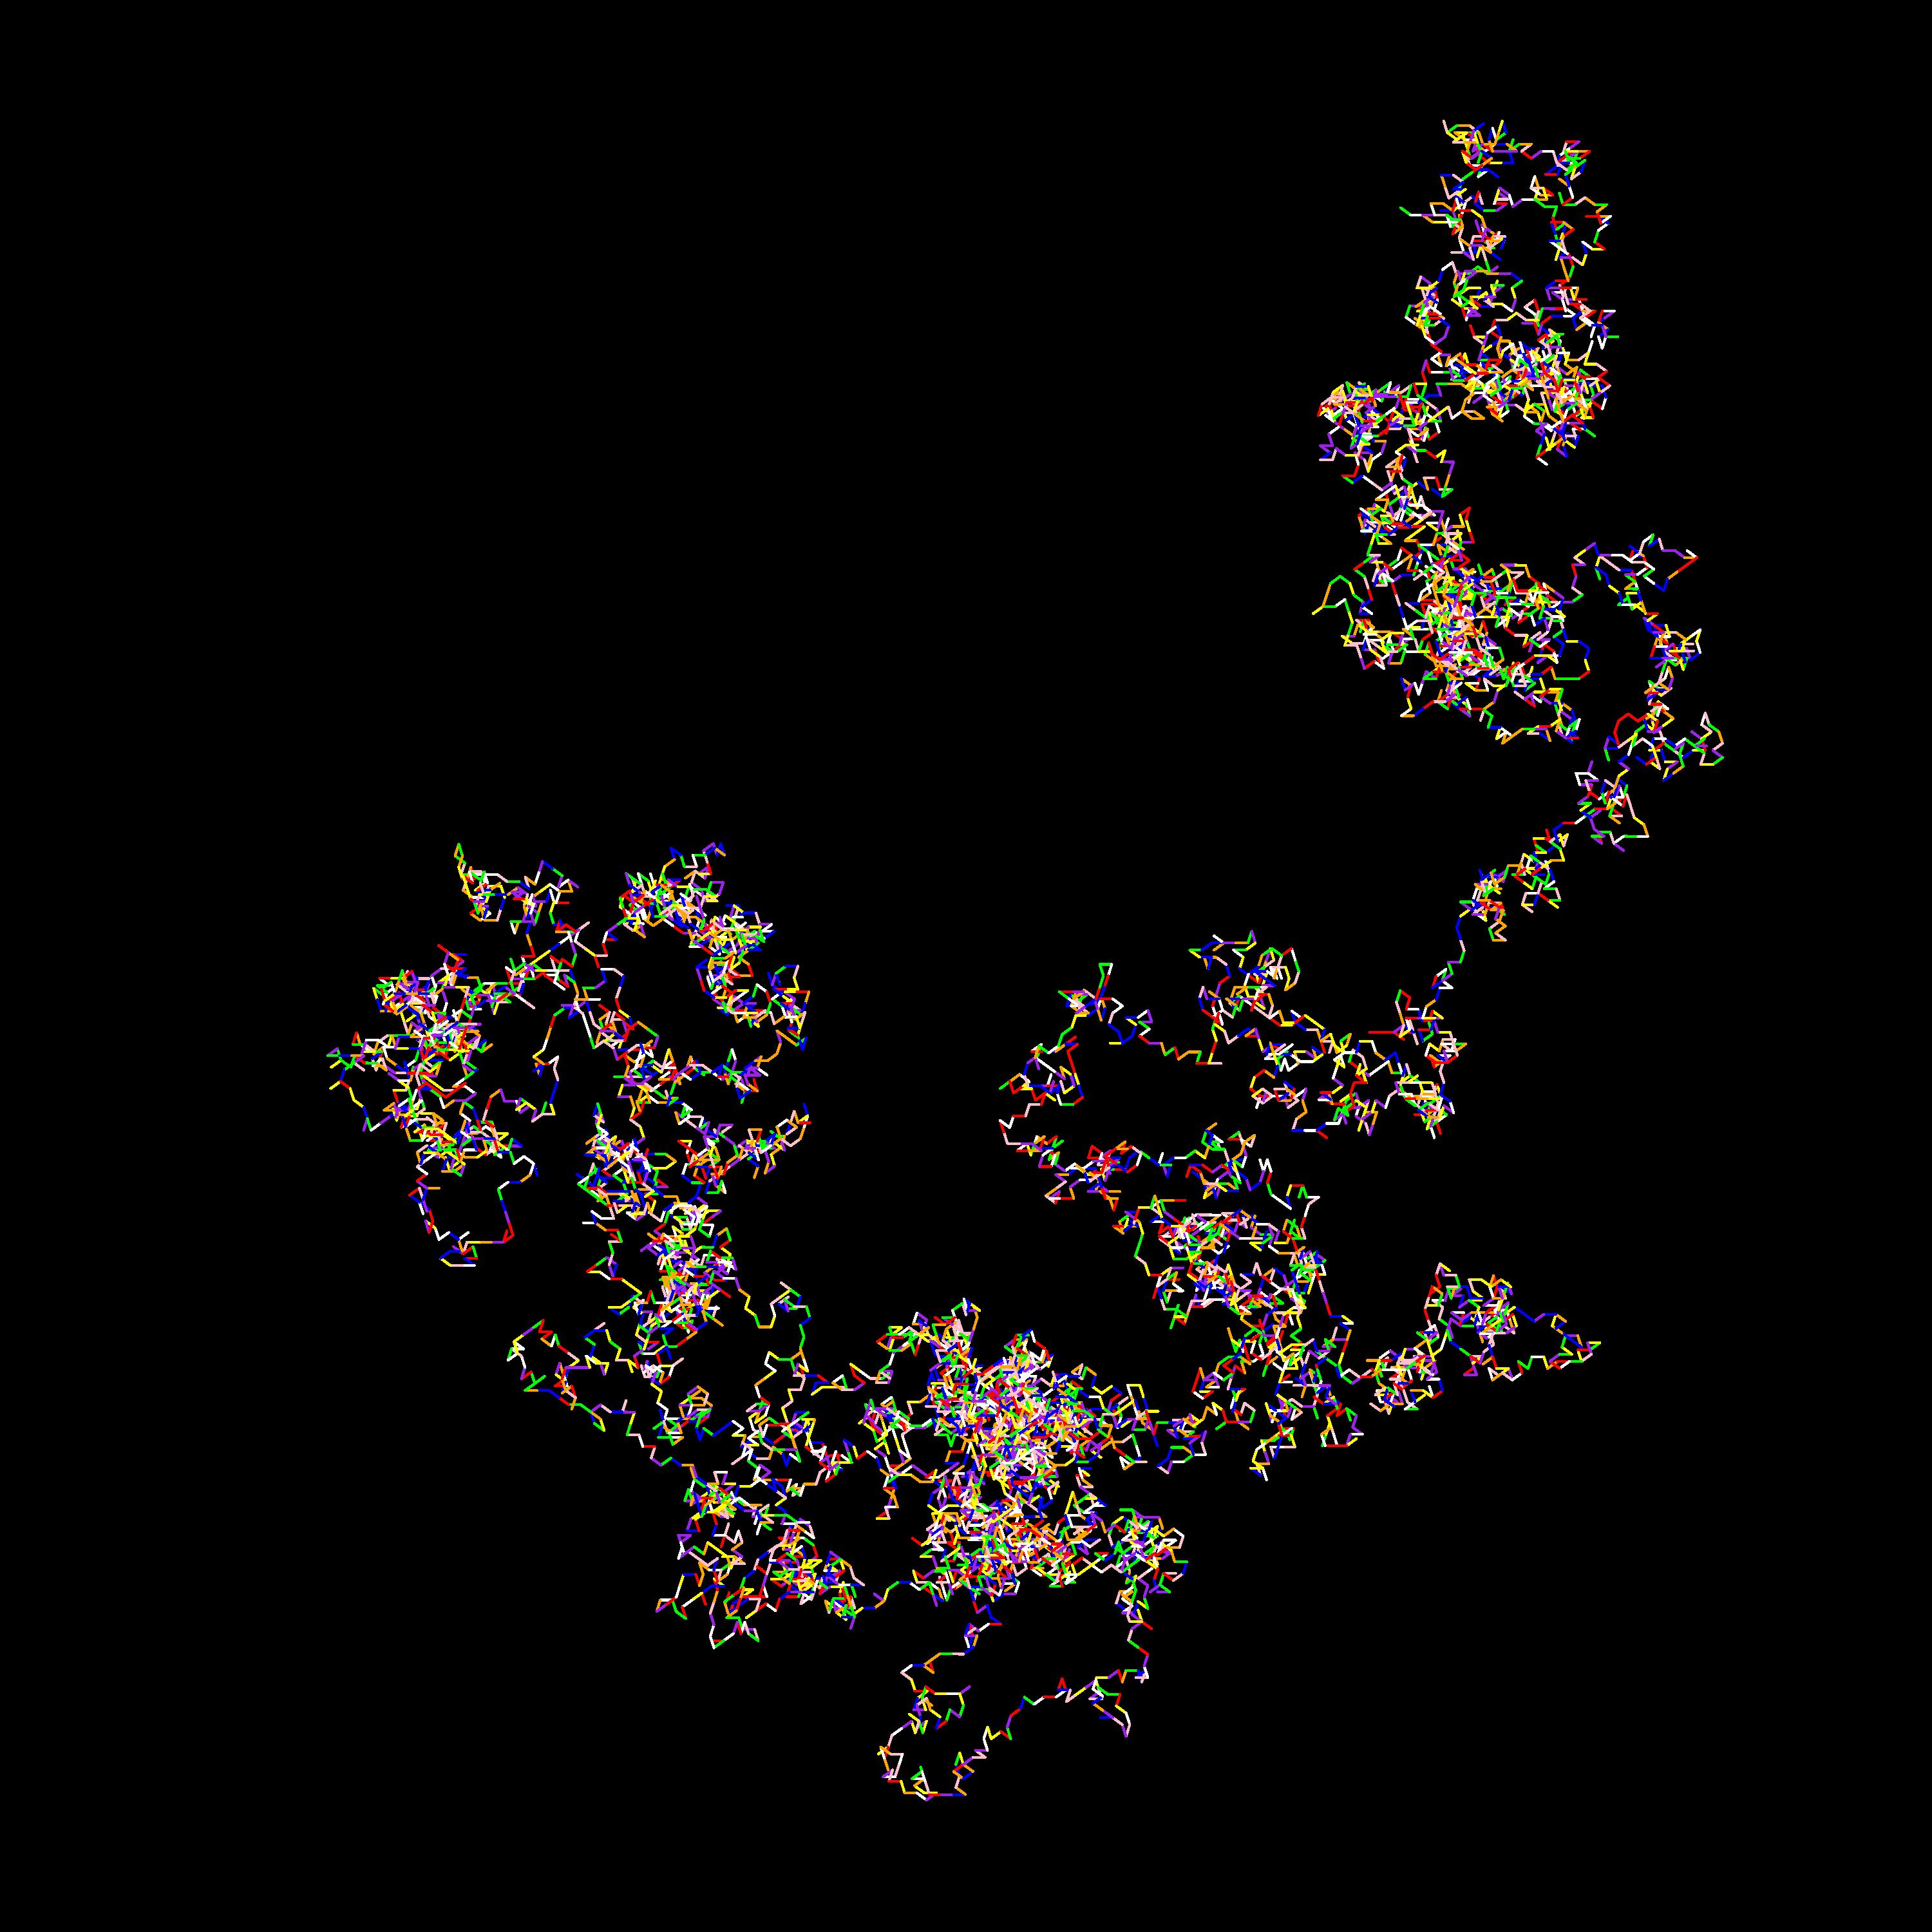
First 10001 digits of pi
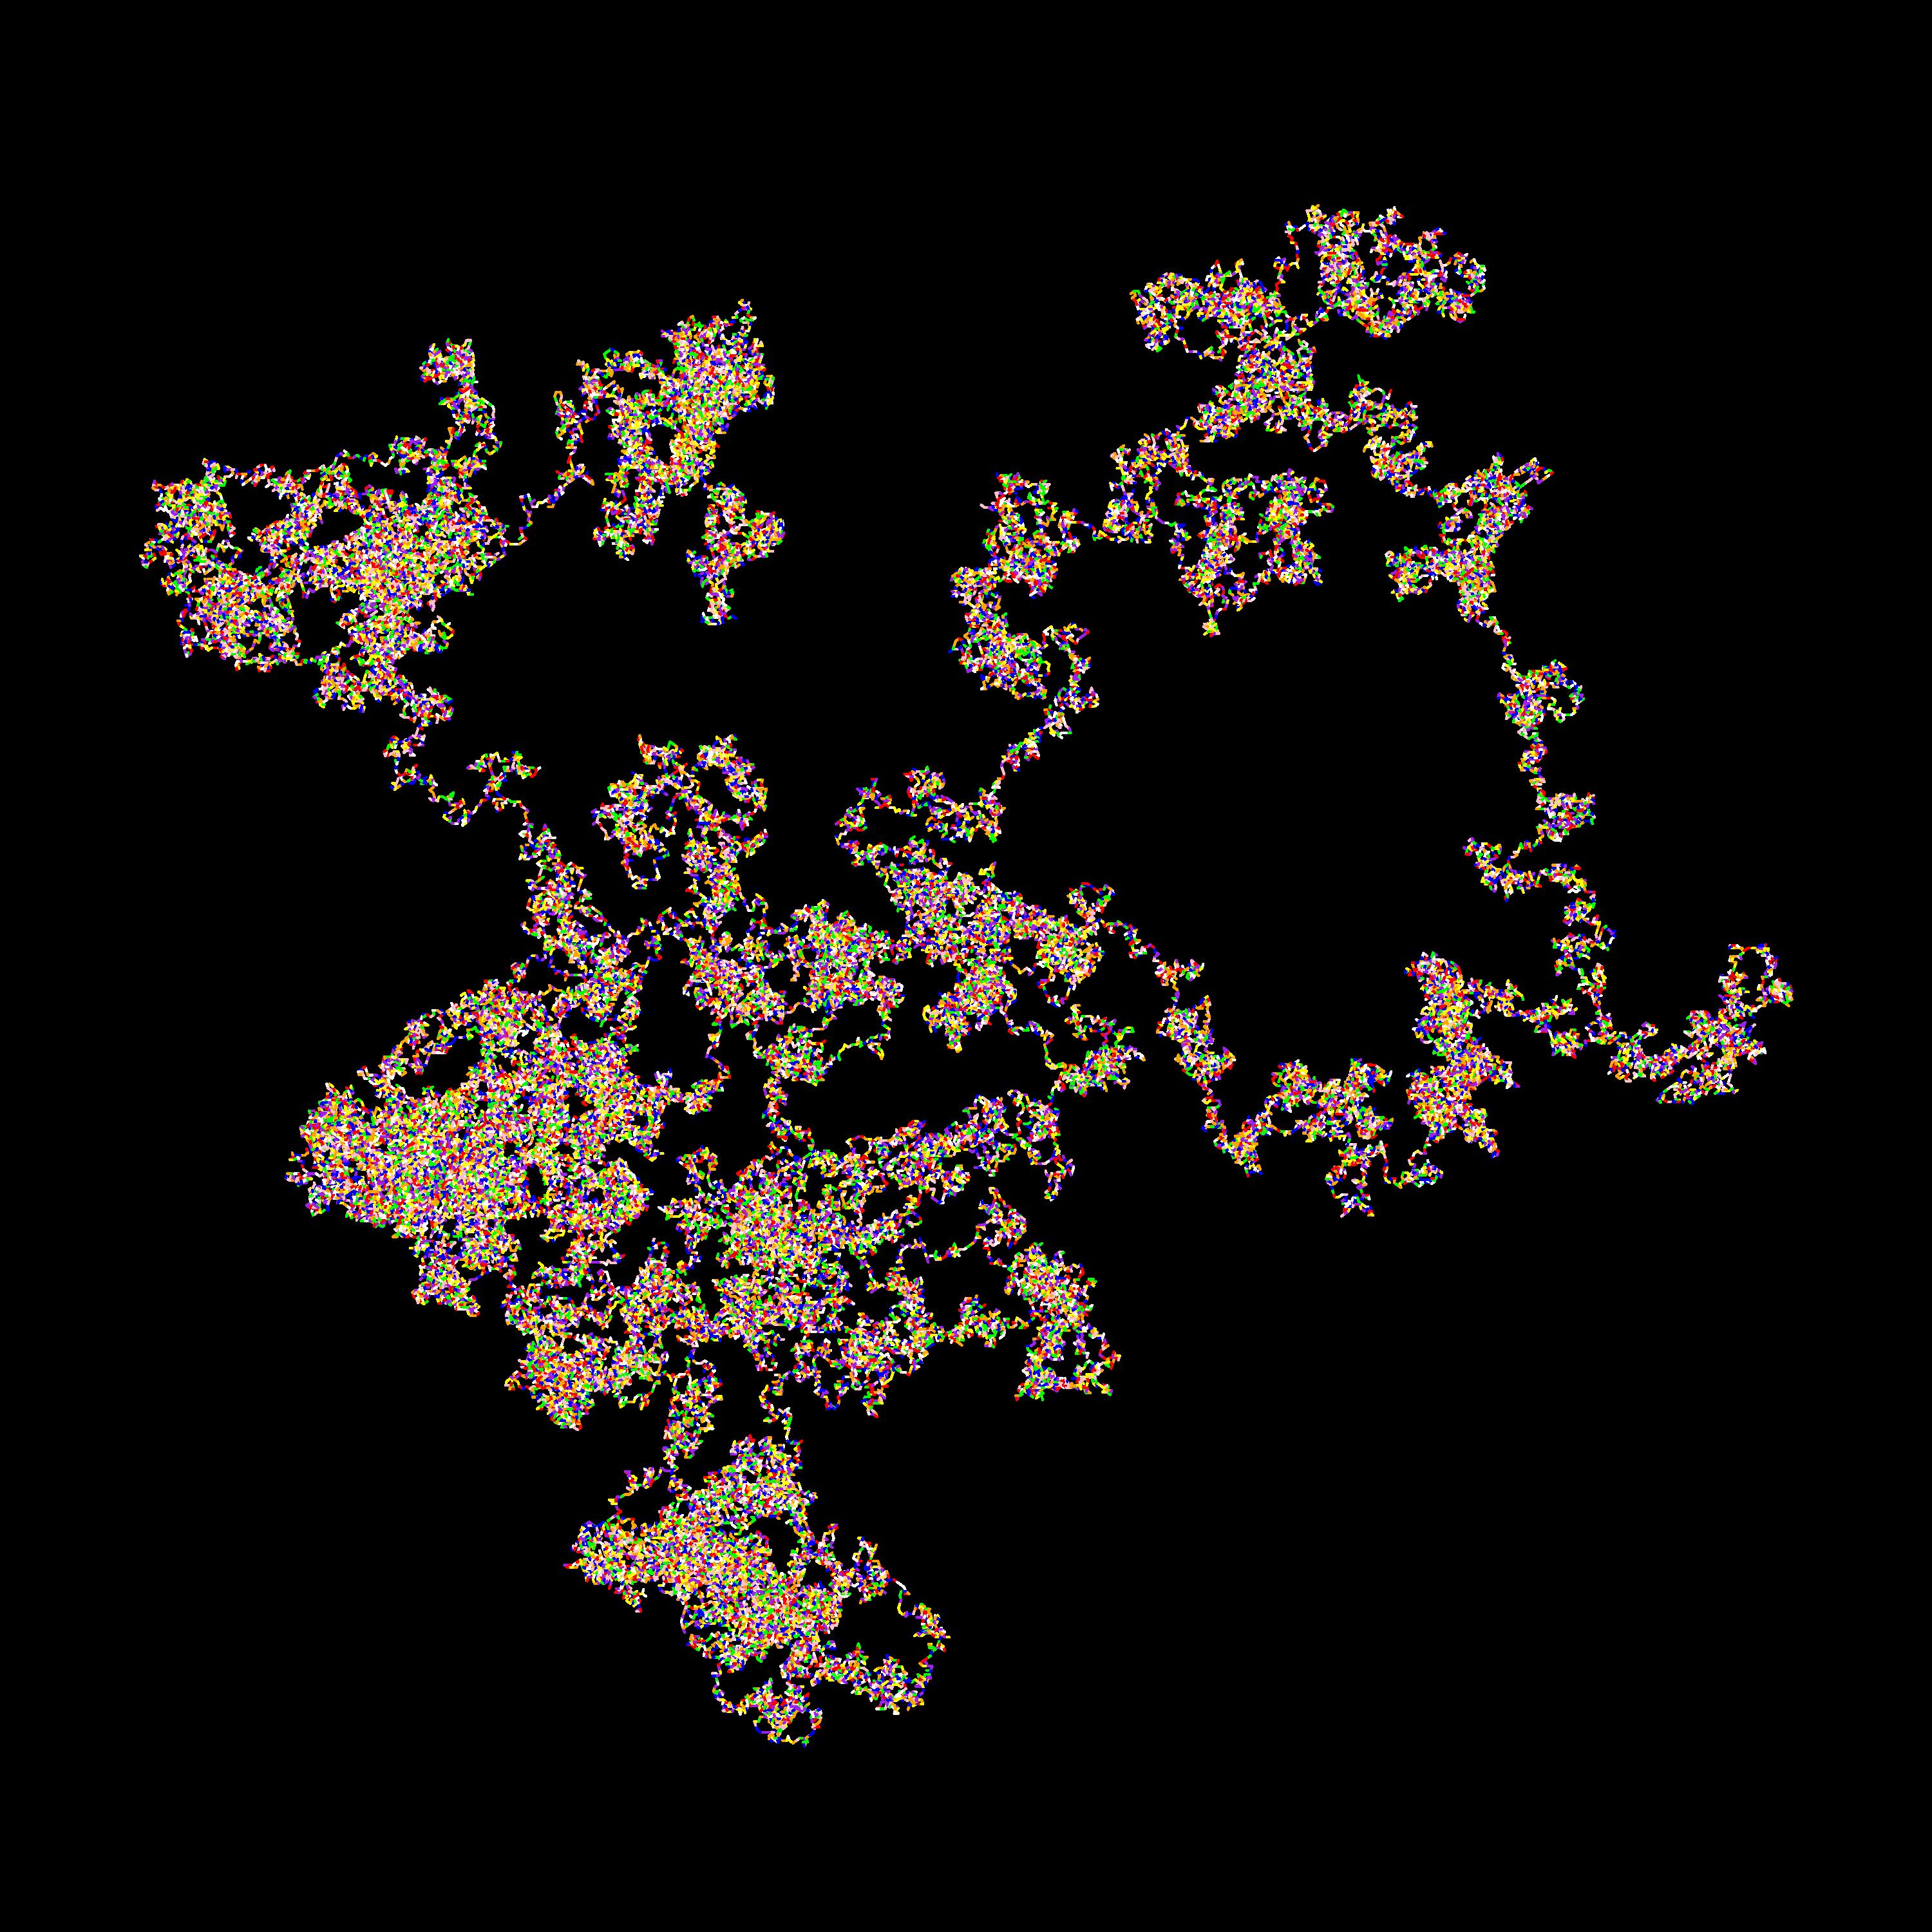
First 100001 digits of pi
You can find the R script (make_a_pi.R) to create these figures here.